Shiny aRt
"Help with your data!"
About
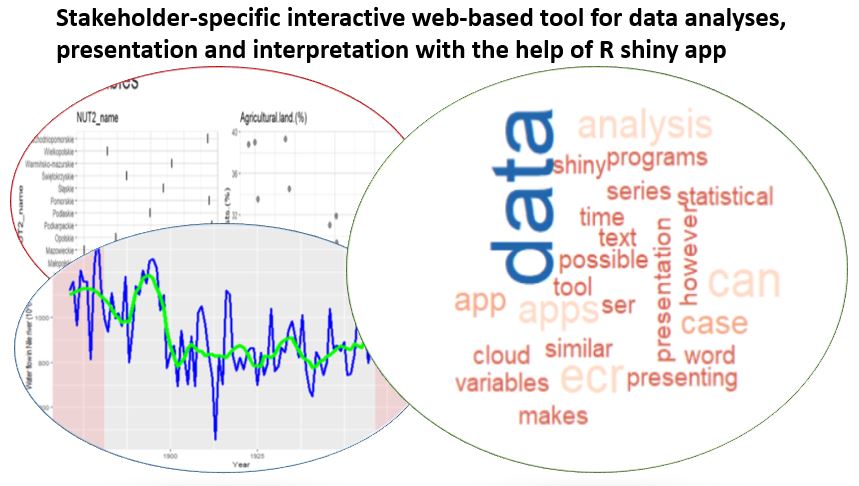
Stakeholder-specific interactive web-based tool for data analyses, presentation and interpretation with the help of R shiny app
R shiny application makes it possible to create an interactive web surface which makes it possible to interpret, show, figure and analyse data without specific knowledge of statistical programs. This tool can be appropriate for the presentation of your data, however, for scientific papers there is a need for further – more detailed analysis with some statistical programs. We developed some shiny apps, that can be useful for SER in LS, and that can be extended with more similar apps, if needed.
So far, we prepared three apps.
- The first app shows how time series data can be smoothed. We used the dataset of annual water flow in Nile River as an example for showing how to smooth row data for a more successful data presentation. Similar panel datasets occur in SER.
- The second app allows ECR to browse their own Excel data files, and the script connects them to explanatory data analysis. After choosing the target variable, other data within the file will be plotted against it; in case of discrete variables as a boxplot, in case of continuous variables as a regression line. This helps in finding eventual relationships and forming hypotheses. For further analysis, however, it is advised to get proper statistical analysis.
- The third app gives a possibility for ECR to present their data in the form of a word cloud. This is a fancy way of presenting the most important clues of a text. ECR can copy a text into the box, and choose word cloud colours.
These apps offer ECR a preliminary tool for interpreting, presenting and analysing their data and also provide help in communication with stakeholders during socially engaged research.
Target group
- ECR
Benefits of using the Tool
- ECR can better explore their data
- Possible presentation of data